
Marketbriefing 05. - 09. January 2026
- 10. Jan.
- 7 Min. Lesezeit
MILF Weekly Report
The week of December 29, 2025 - January 2, 2026 saw modest declines in US markets amid rising Treasury yields and year-end positioning, with rotation into value stocks providing some support. European indices posted gains on stable data, while Asian performances were mixed, led by strong rebounds in Korea and Taiwan offsetting yen pressures in Japan.

European Markets:
Indices advanced on manufacturing stability and ECB optimism. The FTSE 100 rose 0.7%, DAX gained 1.2%, and CAC 40 added 0.4%. The MSCI EAFE climbed 0.6%, with broader sentiment upbeat despite trade concerns.
Asian Markets:
Mixed results, with Korea's KOSPI surging 5.8% on tech strength and Taiwan up 2.8%. Japan's Nikkei fell 0.3% amid yen appreciation, Shanghai Composite rose 0.8% on stimulus hopes, and Hang Seng dipped 1.0%.
Back to 2025
2026 looks set to deliver another strong performance—if we can trust the latest consensus estimates (primarily from FactSet and major Wall Street firms like Goldman Sachs, Bank of America, and others). Analysts are projecting S&P 500 earnings growth of around 14-15% for the year (FactSet currently at 15.0%, Goldman at 12%, with many others in the 12-15% range). This would mark the third consecutive year of double-digit profit expansion, driven largely by AI productivity gains, solid revenue growth (~7%), and margin improvements to potentially record levels near 13.9%.

Venezuela - Oil Prices Declining?
Oil prices are projected to decline further into early 2026, driven by a significant global surplus and subdued demand growth. The Brent crude oil price is forecasted to average around $55 per barrel in the first quarter of 2026, remaining near that level throughout much of the year, according to the U.S. Energy Information Administration (EIA). Analysts anticipate a glut of up to 3.85 million barrels per day, with West Texas Intermediate (WTI) expected to hover between $49 and $57 per barrel. This downward pressure stems from increased non-OPEC production, OPEC+ decisions to pause output hikes, and slower economic growth in key markets like China.
U.S. Policy on Oil and Gold Production, International Division
Under President Trump, U.S. policy emphasizes aggressive expansion of domestic oil production to achieve energy dominance and lower prices, encapsulated in the "Drill, Baby, Drill" approach. This includes plans for U.S. oil companies to invest billions in revitalizing Venezuela's oil infrastructure following recent military actions, aiming to tap into its vast reserves (over 300 billion barrels) and boost global supply. Gold production receives less focus but aligns with broader resource extraction on federal lands. Internationally, there's no emphasis on equitable division; instead, the policy prioritizes U.S. interests, potentially displacing competitors like China and Russia from Venezuelan oil, which could lead to tensions with OPEC+ nations such as Saudi Arabia. Despite promises, actual U.S. rig counts have declined, though output remains high.
Time to Build Refinery, Mines; Location of Resources
Constructing a new oil refinery typically takes 4-7 years, including 2 years for engineering and permitting, 2-4 years for construction, and 6-12 months for commissioning and testing. For mines and fields, timelines vary: shale developments can ramp up in weeks to months, while conventional or offshore projects may require 5-10 years or more from exploration to full production. Key resource locations are well-known, including the U.S. Permian Basin for shale oil, Venezuela's Orinoco Belt for heavy crude, and Alaska's North Slope for additional U.S. reserves. Gold deposits are mapped in areas like Nevada and Alaska, but expansion depends on federal approvals.
Transport Routes, New Ships, Manufacturers
Existing transport routes, such as pipelines (e.g., Keystone XL extensions) and major shipping lanes like the Strait of Hormuz, Panama Canal, and Atlantic routes, are sufficient for current volumes but could face bottlenecks with increased Venezuelan output. The tanker market is expected to remain tight through early 2026, with elevated rates due to a shrinking fleet and sanctions on shadow vessels. New ship orders may rise, with the global tanker market projected to grow; key manufacturers include South Korean yards like Hyundai Heavy Industries and Chinese builders. Publicly traded companies with high upside potential include Frontline (FRO), Teekay Tankers (TNK), and Euronav (EURN), benefiting from fleet expansions and higher charter rates.
Fixed Contracts, Duration, Impacts of Falling/Rising Prices, Average Price; Hedging Strategies
Oil companies commonly use fixed-price contracts and hedging instruments like futures, swaps, and options to manage price volatility, with average durations of 1-2 years. In falling markets (like the projected $55/bbl Brent in 2026), firms with high fixed hedges (e.g., above $60/bbl) gain by selling at premiums, while unhedged or spot-market sellers face revenue squeezes, potentially cutting capex. Rising prices reverse this, benefiting flexible sellers but exposing hedged firms to opportunity costs. Current average hedged prices range from $50-70/bbl, with producers hedging 20-40% of output. Hedging strategies in 2026 focus on downside protection amid low prices, with shale producers locking in $4+/Mcf for gas and increasing put options for oil; however, under-hedging (e.g., only 21% of 2025 output hedged earlier) exposes firms to risks, prompting a rush to hedge at $70+ levels mid-2025. Dynamic hedging, including collars and three-way options, is emphasized for margin protection in a glut environment.
Who Got Sources/Mines in the Past
Historically, U.S. oil leases and mining rights have been assigned through competitive auctions under the Mineral Leasing Act of 1920, prioritizing bids on federal lands with royalties (minimum 12.5%) and environmental compliance. Major recipients include integrated giants like ExxonMobil and Chevron, which secure large onshore and offshore blocks, and independents like Occidental and Pioneer in shale-rich areas like the Permian. Private minerals are leased directly from landowners, often favoring established operators with technical expertise.
MAGA/Trump Supporters in Oil
The oil industry has been a strong backer of Trump and MAGA policies, with fossil fuel interests donating over $75 million to his 2024-2025 campaigns and influencing Republican agendas. Key supporters include Harold Hamm (Continental Resources), Kelcy Warren (Energy Transfer), and companies like ExxonMobil, Chevron, and Marathon Petroleum. Less public but significant are Koch Industries via PACs and Occidental through lobbying. These ties have yielded deregulation and expanded leasing, though low prices challenge the sector.
Who Profits from Buildout (Pipes, Pumps, Steel)
Infrastructure buildout, particularly in Venezuela and U.S. expansions, benefits suppliers like pipe manufacturers Tenaris and Vallourec, pump and service providers Schlumberger and Halliburton, and steel producers Nucor and U.S. Steel. Midstream companies such as Enterprise Products Partners and Kinder Morgan gain from pipeline and storage projects, while engineering firms like Bechtel handle construction. Overall, M&A in infrastructure could exceed $200 billion, favoring integrated players like Chevron.
Overall Buildout Time; Views of Other Powers, Preferred Division
Full infrastructure buildout, from refineries to fields, typically spans 4-10 years depending on scale and location. China views U.S. expansion skeptically, as it disrupts its access to discounted Russian and Venezuelan oil, prompting deeper ties with Moscow and stockpiling to cushion impacts. Russia fears price crashes from U.S./Venezuelan supply, preferring stable OPEC+ quotas and alliances to maintain revenues.
Impacts on Gas Market
U.S. oil expansion policies indirectly buoy the natural gas market in 2026, as associated gas from shale oil production increases supply, but low oil prices could curb drilling and limit gas output growth. Henry Hub prices are forecasted at $3.90/MMBtu, up from prior years due to LNG export demand and potential supply disruptions. Geopolitical shifts, like U.S. actions in Venezuela, may heighten volatility, while China's stockpiling and Russia's export focus could stabilize global gas flows but pressure prices if oil gluts spill over. Overall, gas markets face headwinds from abundant supply but opportunities in LNG amid energy transitions.


Oil Market
Bearish views see potential drops toward $50s, eventually an 30-40% crash to $40 WTI or $36 in Brent.


Tech Dominance and the Shift to Value Stocks
Tech stocks have dominated markets for over 15 years, consistently outperforming value stocks since the post-2008 recovery. From 2010 onward, the tech sector benefited from low interest rates, rapid innovation (cloud, mobile, AI), and massive earnings growth from giants like the Magnificent Seven, delivering annualized returns often exceeding 20% in rolling periods.
Value stocks (e.g., Russell 1000 Value or S&P 500 Value) lagged significantly during this era, with growth outpacing value by wide margins in most years since 2007.
Outlook for 2026: Potential Rotation Ahead
Many analysts predict 2026 could mark the first year value stocks perform equally or better than tech/growth. Key drivers include:
Higher-for-longer interest rates pressuring expensive growth valuations.
Broader market rotation into cyclicals, industrials, and "real assets" amid AI capex maturation and policy shifts (e.g., tariffs, fiscal stimulus).
Undervalued sectors like energy, financials, and consumer staples gaining from resilient GDP and lower multiples.

MSTR Long test

Gold Short

Amazon Intraday

AVAX Long

eBay Long

Severn Trent Plc

Sentiment Warning Signs
Potential Short-Term Risks to the Earnings Rally (Early January 2026)
While the strong earnings growth story has driven impressive market gains in recent years, short-term risks are mounting as several key technical and sentiment indicators flash cautionary signals.
Low Cash Levels Among Fund Managers
Cash allocations in BofA's Global Fund Manager Survey have fallen to record lows—around 3.3-3.5% in the latest December readings, the lowest in survey history. Historically, such minimal dry powder acts as a contrarian indicator: when managers are fully invested, there's little buying power left to support further upside, increasing vulnerability to pullbacks.
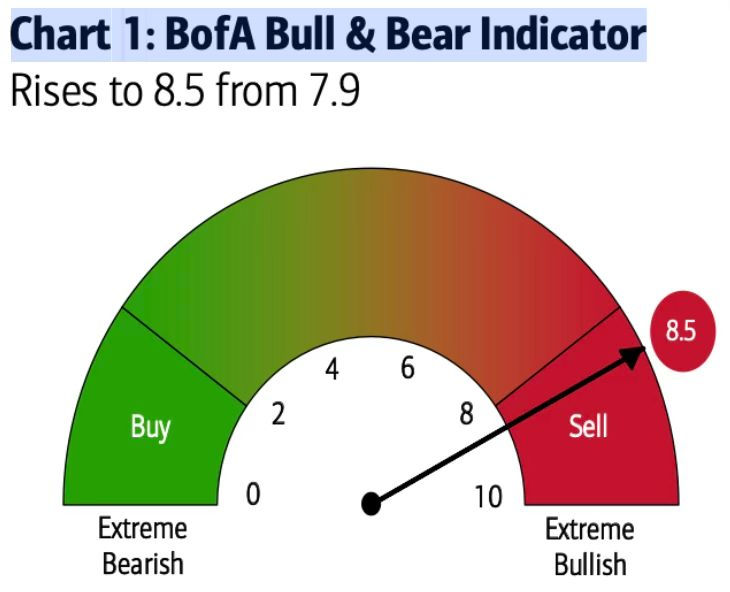
BofA Bull & Bear Indicator Enters Critical Zone
The proprietary BofA Bull & Bear Indicator, a composite of investor positioning, flows, and sentiment, surged to 8.5 in late December (up from 7.9), officially triggering a contrarian "sell" signal for risk assets. Readings above 8 signal extreme bullishness, often preceding corrections as euphoria peaks. This is the highest since early 2020 and aligns with the most optimistic fund manager sentiment in 3.5 years.
Additional Technical Red Flags
Broader indicators reinforce caution: elevated valuations (Shiller P/E near bubble levels), declining volume on recent rallies, and emerging bearish divergences in momentum oscillators (e.g., RSI, MACD on S&P 500 charts). While not yet confirming a major reversal, these suggest the earnings-driven rally could face headwinds in the near term.
Sourches:
Kommentare